Data Monitoring and Device Control
This section discusses how to monitor data and control devices through Neuron. It details how to access and understand the data monitoring interface, as well as how to modify and validate changes in device values directly from the Neuron dashboard.
Data Monitoring
Select Data Monitoring under the Monitoring menu to enter the data monitoring interface to view the values read by the created tags, as shown in the figure below.
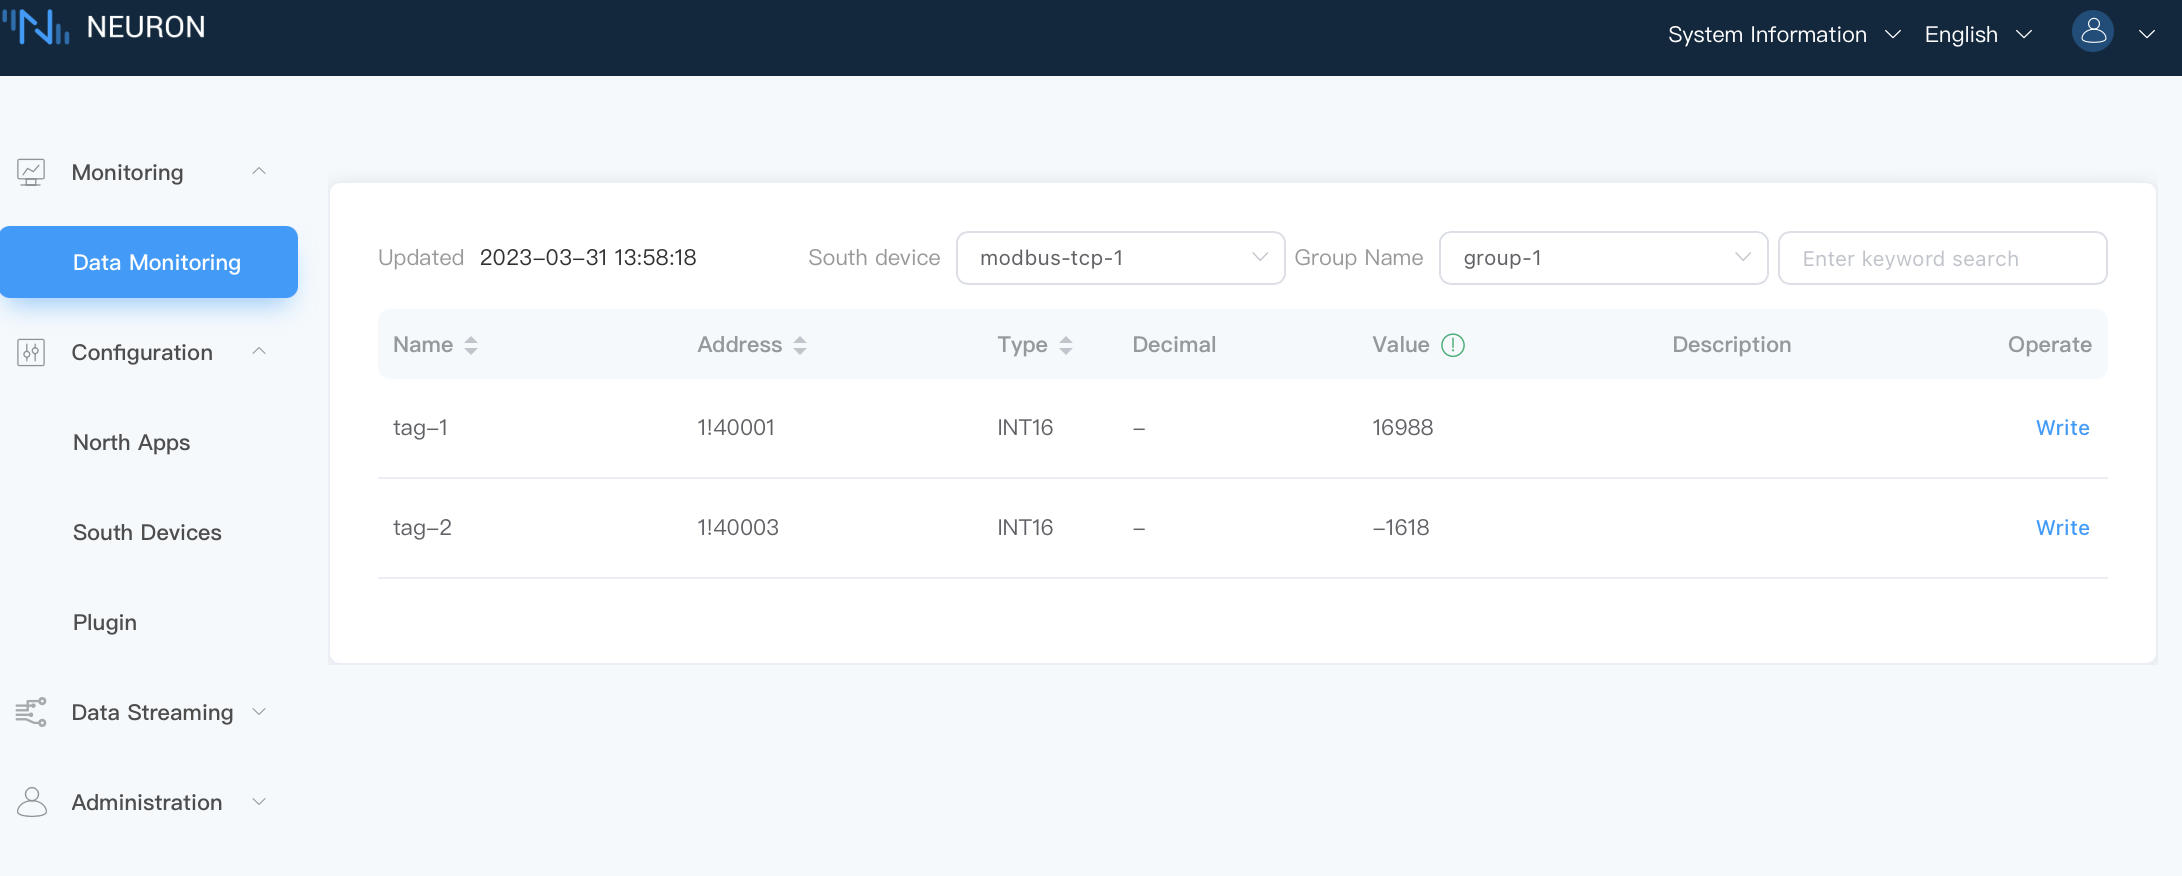
- Southbound device: select the southbound device you want to view, for example, select modbus-tcp-1;
- Group name: select the group under the selected southbound device, for example, select Group-1;
- Data monitoring displays values in groups, and the page will show the value of each tag read under the group.
Control Devices
Change the value from Neuron dashboard
When the tag is set with the write attribute, the Tag of the data monitoring interface will have a write operation. Click on Write button and input a value to control device. For example, modify the value of the 1!40001 point address with the write attribute, as shown below.
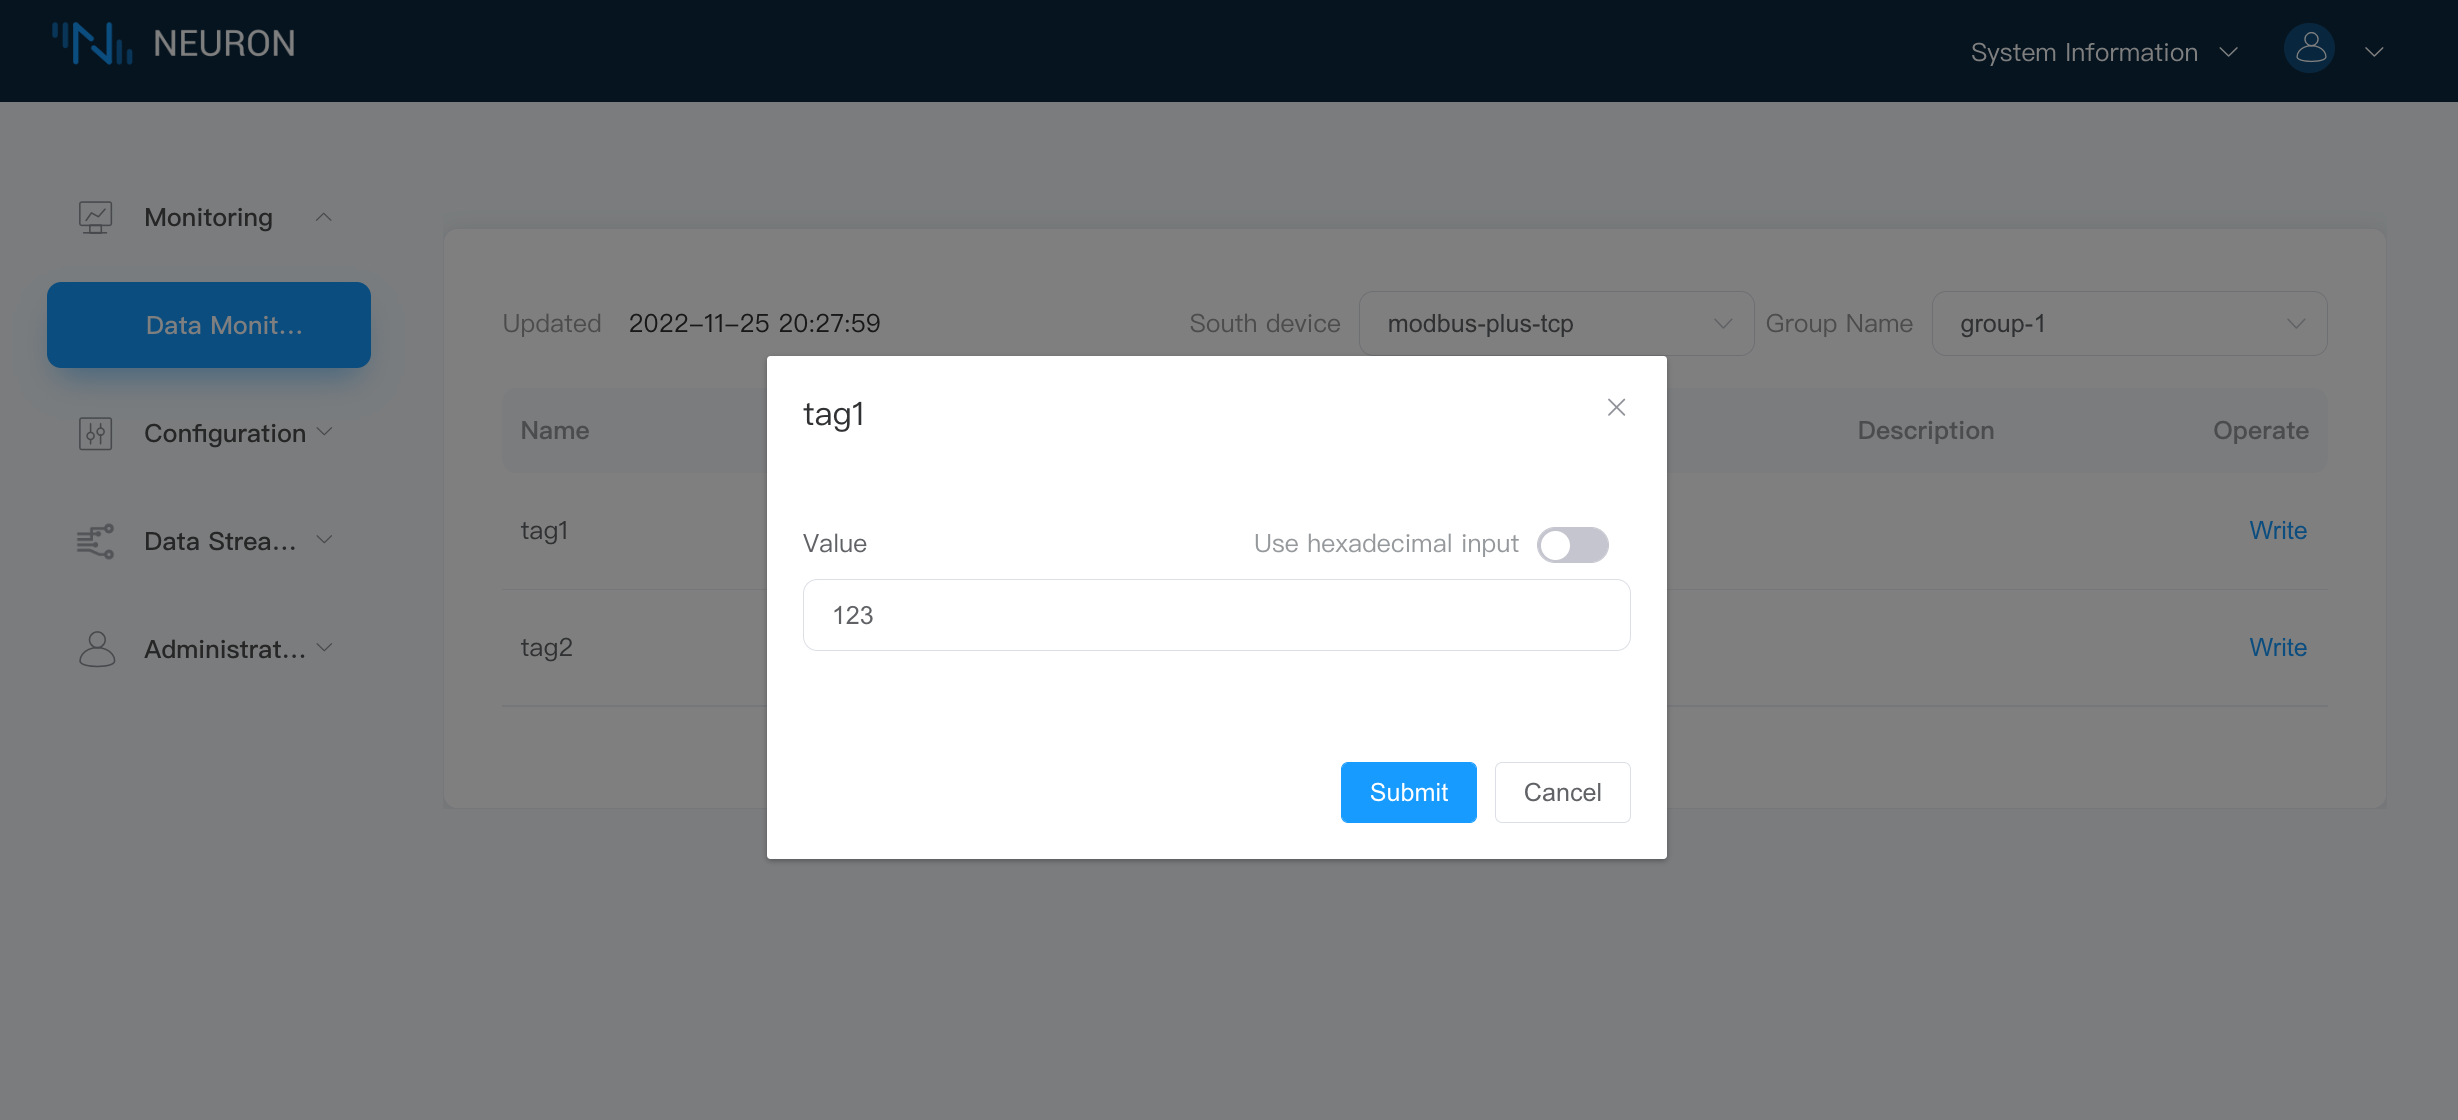
- Click on the write button at the end of the label to be changed;
- Select whether to input in hexadecimal format, not select;
- Enter a new value for the label, e.g. 123;
- Click on the Submit button to submit the new value.
TIP
This point in the device must also have the writable attribute, otherwise it cannot be written successfully.
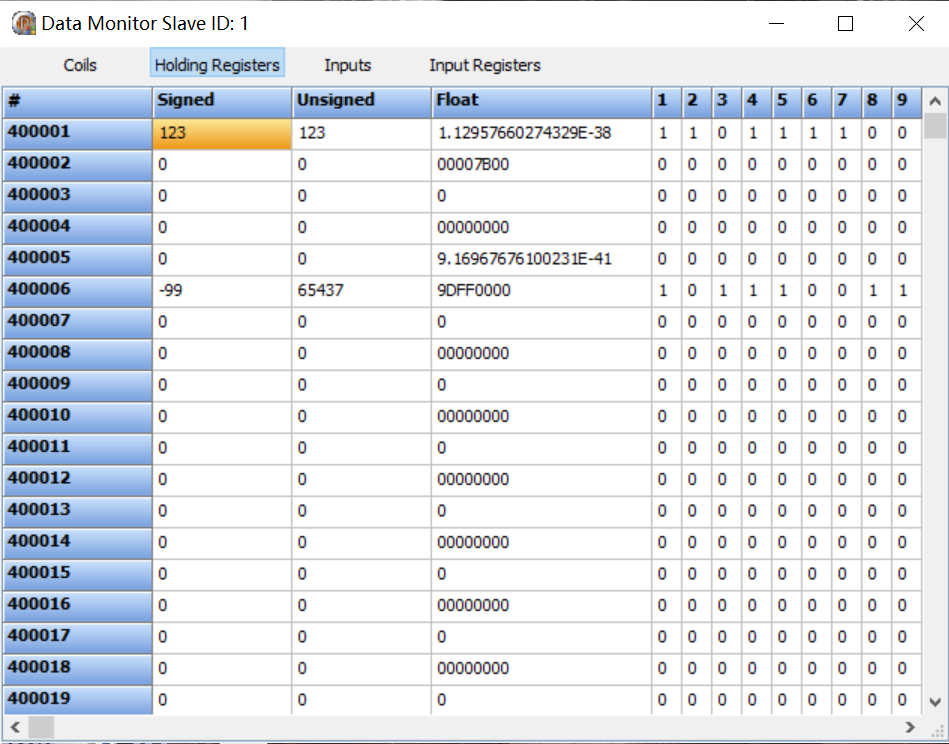
Verify the Result
Check over the Modbus simulator whether the point value has changed to the same input value as above.