Performance Statistics
Neuron supports the north-south node data statistics function based on Prometheus data model, which is used to monitor the running state of nodes. The basic principle of Prometheus is to periodically capture the status of monitored components through HTTP protocol. Any component can access monitoring by providing the corresponding HTTP interface. Neuron provides the corresponding interface and can successfully access Prometheus for monitoring.
Each node card has an operation button of Data statistics, which is used to display the statistical information of the node. At present, Neuron has realized the statistics of some global fields and north-south fields, and will continue to increase statistical fields according to the demand.
Global Statistics
Some global fields are described below.
| Parameters | Description |
|---|---|
| uptime_seconds | Displays the running time of Neuron, and the page is refreshed at a frequency of 5 s |
| core_dumped | Shows whether there is any abnormality in the running state of the system |
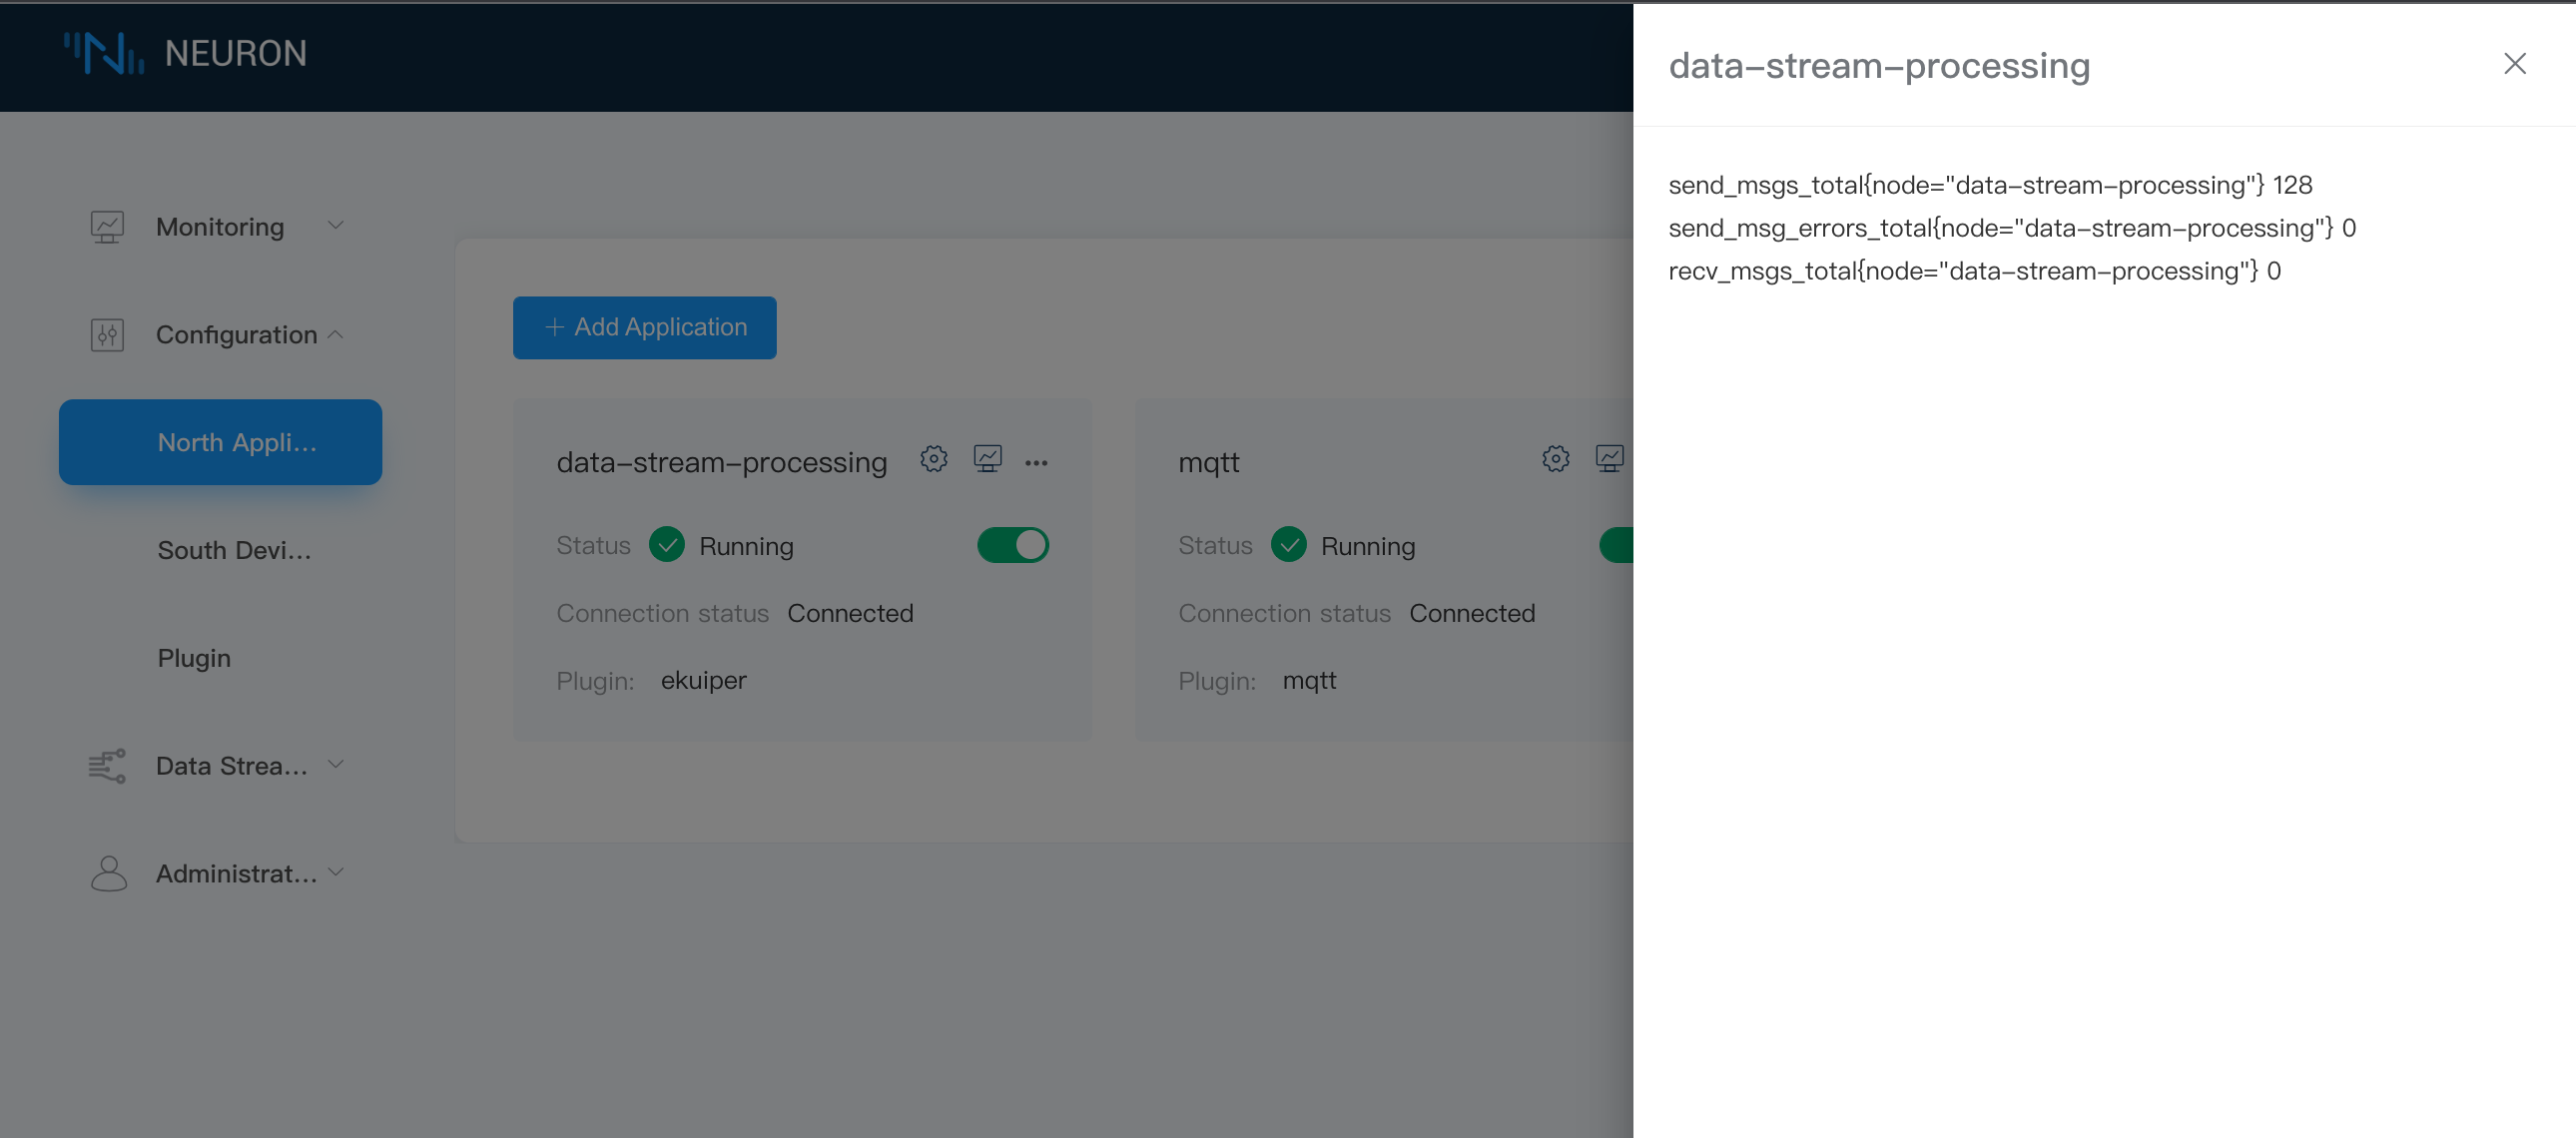
Northbound Node Statistics
The northbound application node already supports the statistics of some fields, but there will be some differences in the fields to be counted for each application. There are plans to update the statistical fields of each application in the later version, and some fields are described below.
| Parameters | Description |
|---|---|
| send_msgs_total | Total number of sent the messages |
| send_msg_errors_total | Total number of failed messages sent |
| recv_msgs_total | Total number of received the messages |
| link_state | link state of the node DISCONNECTED = 0 CONNECTED = 1 |
| running_state | running state of the node INIT = 1 READY = 2 RUNNING = 3 STOPPED = 4 |
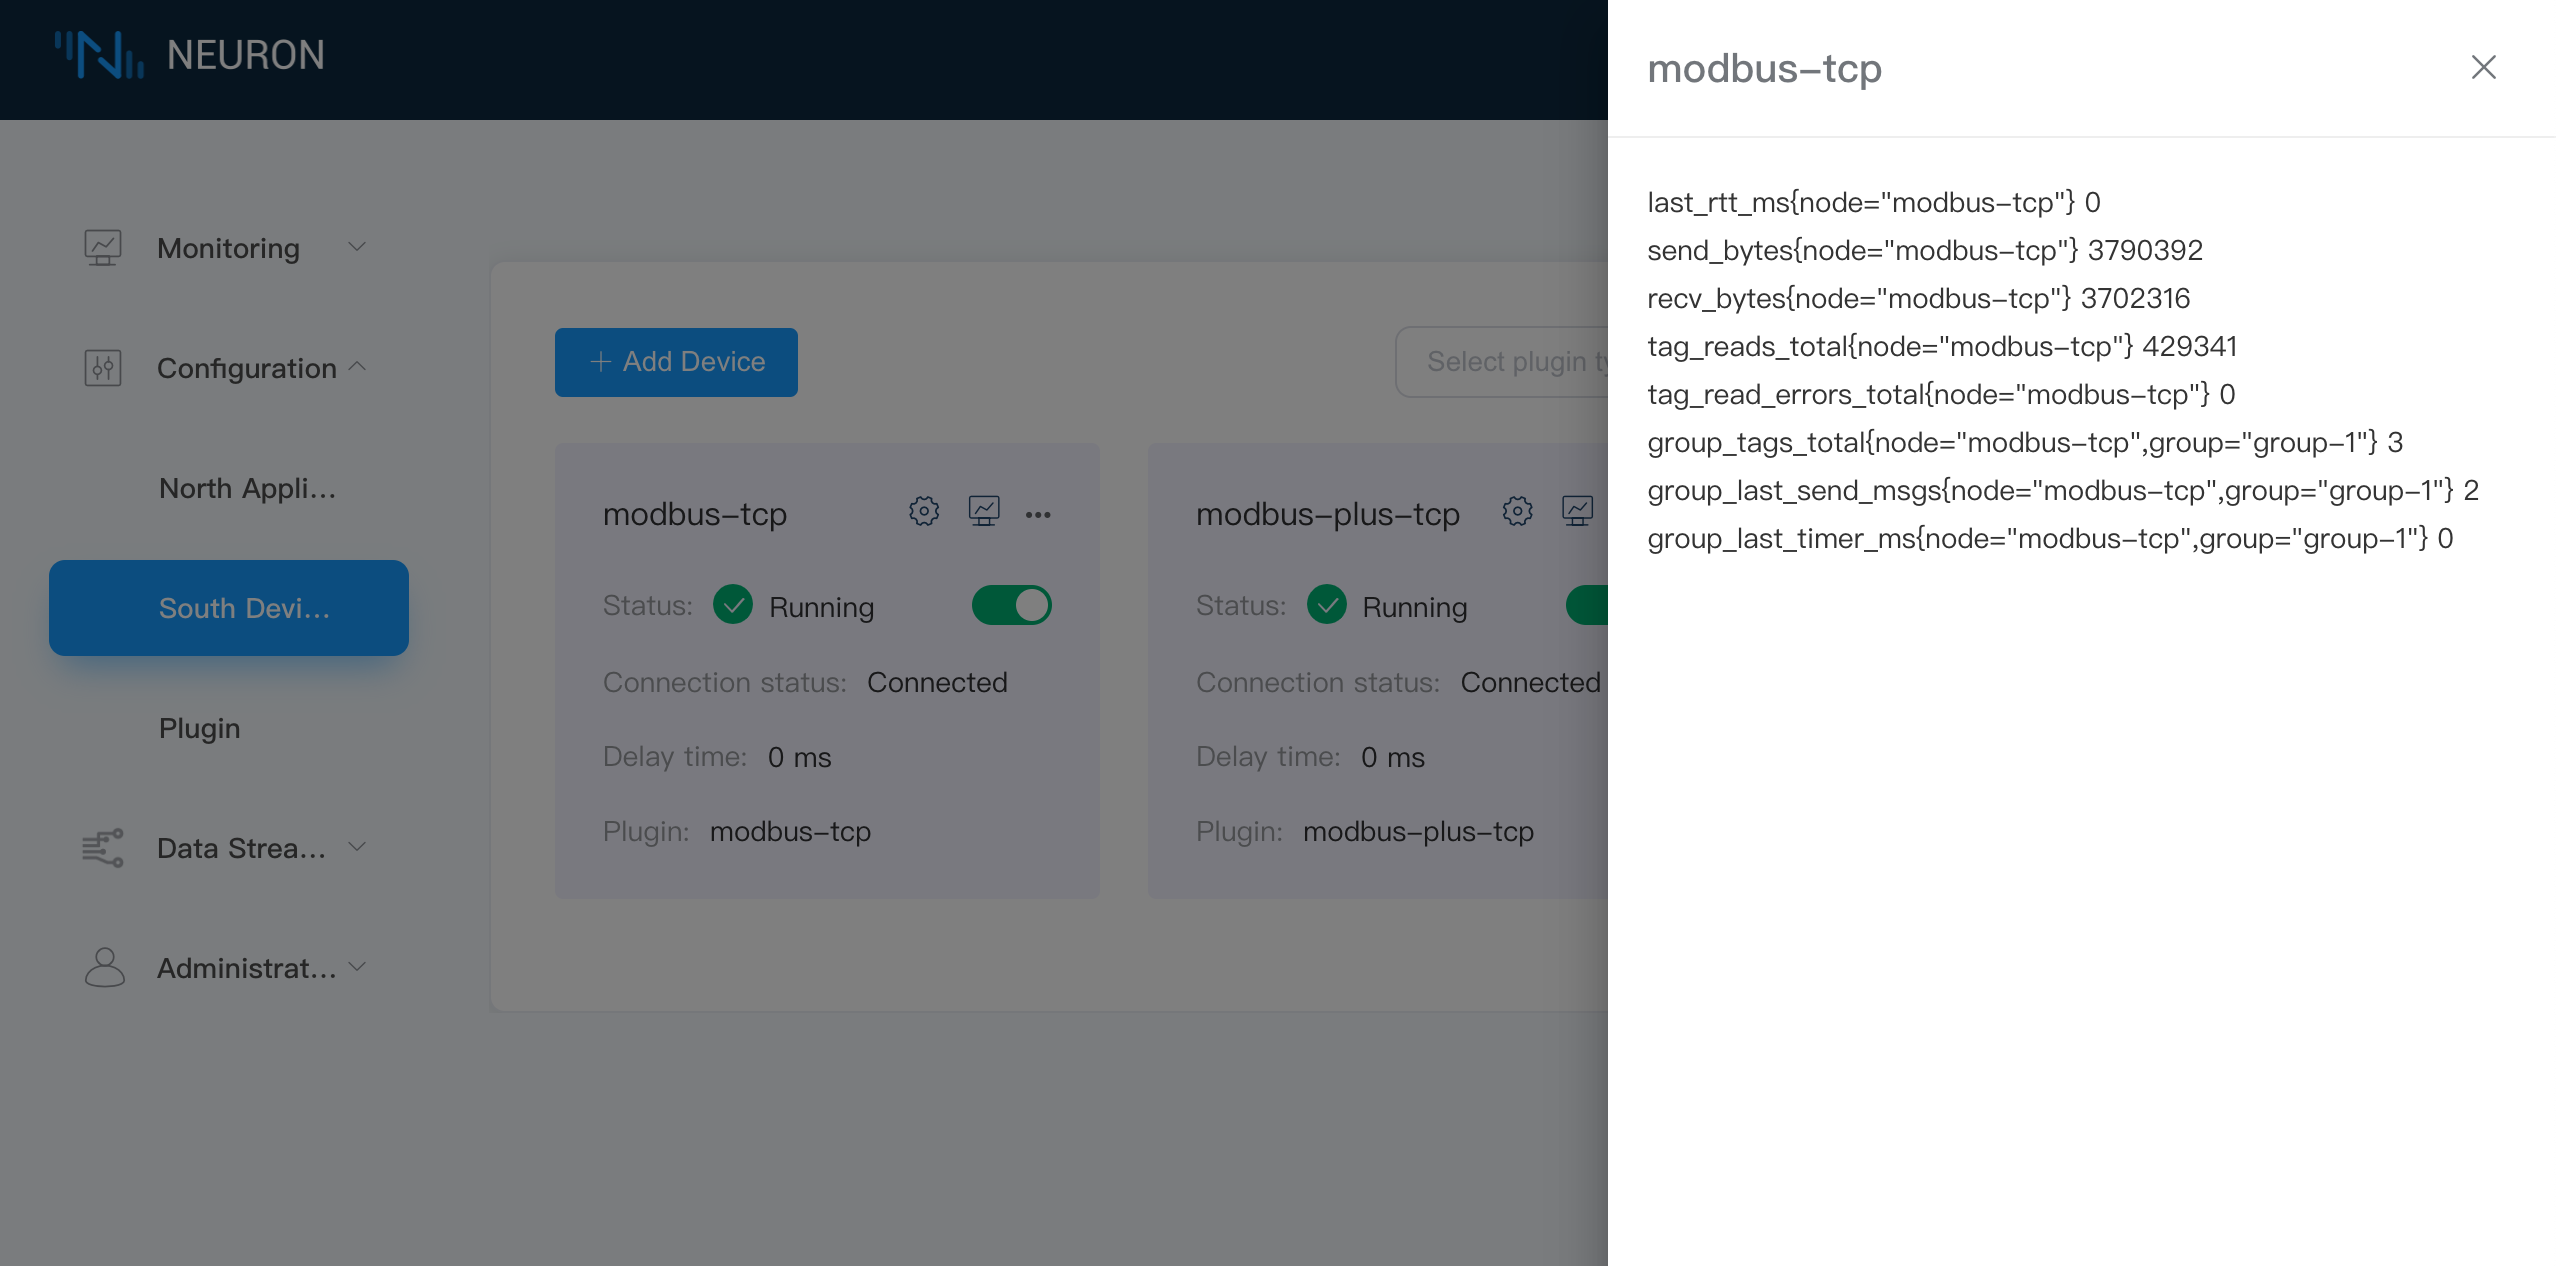
Southbound Node Statistics
The southbound node already supports the statistics of some fields, but there are some differences in the fields to be counted for each driver. Later versions have plans to update the statistical fields of each driver continuously. Some fields are described below.
| Parameters | Description |
|---|---|
| last_rtt_ms | The interval between sending and receiving a command, in milliseconds |
| send_bytes | Total number of bytes of sent commands |
| recv_bytes | Total number of bytes of received commands |
| tag_reads_total | Total number of commands to read the tags, including read failures |
| tag_read_errors_total | Total number of commands that failed to read the tags |
| group_tags_total | Total number of tags in the group |
| group_last_send_msgs | Number of messages sent by calling group timer once |
| group_last_timer_ms | The time when the group timer is called once, in milliseconds |
| link_state | link state of the node DISCONNECTED = 0 CONNECTED = 1 |
| running_state | running state of the node INIT = 1 READY = 2 RUNNING = 3 STOPPED = 4 |